Septic Route Optimization: How to Cut Drive Time and Fuel Costs Without Cutting Service
If you run a septic pumping business in 2026, fuel is killing you. The EIA’s most recent weekly average put on-highway diesel at $5.35 per gallon for the week of April 27, 2026, and the agency’s latest Short-Term Energy Outlook forecasts diesel will average $4.80 per gallon for the full year – up from $3.66 in 2025 and the highest annual average since 2022. For a small fleet running three trucks at 8 MPG and putting 60,000 miles on each truck per year, that’s a fuel bill north of $108,000. A year ago it was closer to $82,000. The $26,000 difference is real money, and it’s coming straight out of your margin.
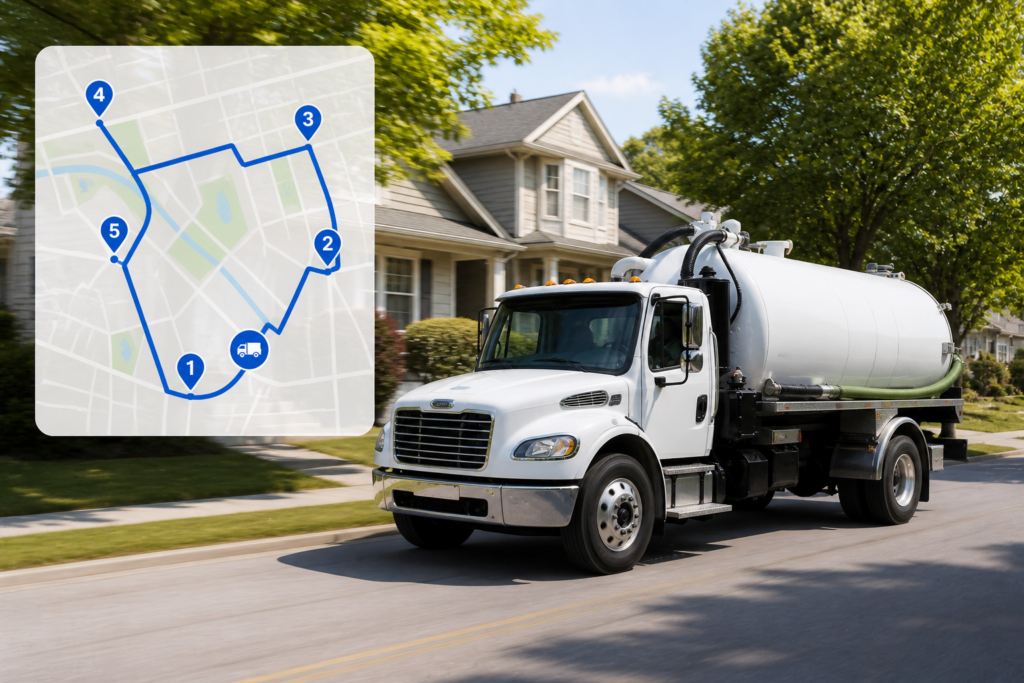
Septic route optimization is the most direct lever you have to pull that money back. This post walks through what optimization actually means in this business, how much you can realistically save, the operational constraints that make septic routing harder than typical delivery routing, and what to look for in software when you’re ready to stop building routes by hand.
The math behind why routes matter so much
A typical residential pump-out takes 45 to 90 minutes on-site. Drive time between jobs varies enormously – and it’s the variable you have the most control over. If your average drive between jobs is 15 minutes, a driver who works 8 productive hours can complete 6 to 8 jobs. If that drive time creeps to 35 minutes, the same driver completes 4 to 5 jobs in the same shift. That’s the difference between a profitable day and a break-even day.
Here’s the rough framework:
- A 75-mile route per truck per day at 8 MPG burns ~9.4 gallons
- At today’s $5.35/gallon, that’s ~$50 in fuel per truck per day
- A 15% reduction in route miles saves ~11 miles, ~1.4 gallons, and ~$7.50 per truck per day
- For a 3-truck fleet running 5 days a week, that’s $5,800 per year in fuel alone
- At the diesel prices we saw a year ago (~$4/gallon), that same fleet would have saved closer to $4,300. Today’s prices make the same routing improvement worth roughly 30% more in dollar terms
That’s just fuel. The bigger savings are usually labor: same drivers, same hours, more jobs completed. If septic route optimization adds even one extra job per truck per day at a $400 average ticket, three trucks running five days a week generate an additional $312,000 in annual revenue with no additional headcount.
Why this is harder than it looks
Routing a septic fleet isn’t the same as routing a pizza delivery. You’re solving a problem operations researchers call the Vehicle Routing Problem with Time Windows (VRPTW), and it’s been proven mathematically NP-hard – meaning the time it takes to find the perfect solution grows exponentially with the number of stops. With just 10 stops there are over 3.6 million possible orderings; with 20 stops the number is larger than the number of atoms in your body. No human dispatcher can hold that in their head, and no spreadsheet can solve it.
What makes septic specifically harder than a standard delivery route is the layering of constraints:
- Truck capacity constraints. A 3,500-gallon truck can typically pump 3-5 residential tanks before it has to drive to a disposal site. The optimal sequence has to know when each truck will hit capacity and route the dump trip in.
- Disposal site constraints. Most operators have 1-3 approved disposal sites. Each has its own hours, gate fees, and acceptance rules (many municipal plants won’t accept grease, for example, per New Hampshire DES guidance). The route has to factor in which dump site is reachable from each cluster of stops.
- Customer time windows. Some commercial accounts only allow service during specific hours. Some residential customers need to be home. Emergency calls jump to the front of the queue.
- Drive time variability. A route that looks great at 8am traffic looks awful at 4pm traffic. Modern routing engines factor in time-of-day traffic patterns rather than treating drive times as fixed.
- Driver constraints. Lunch breaks, DOT hours-of-service rules for CDL drivers, and start/end locations all add layers.
This is why route optimization software exists. A dispatcher with 20 years of experience can build a respectable route for 8-12 stops on a familiar territory. Past that, even great dispatchers leave money on the table – and as soon as a job moves, an emergency comes in, or a driver calls out, the whole carefully-built sequence falls apart.
What “good” actually looks like – benchmarks from adjacent industries
Septic doesn’t have great public benchmark data, but the related waste-collection industry does, and the math transfers reasonably well.
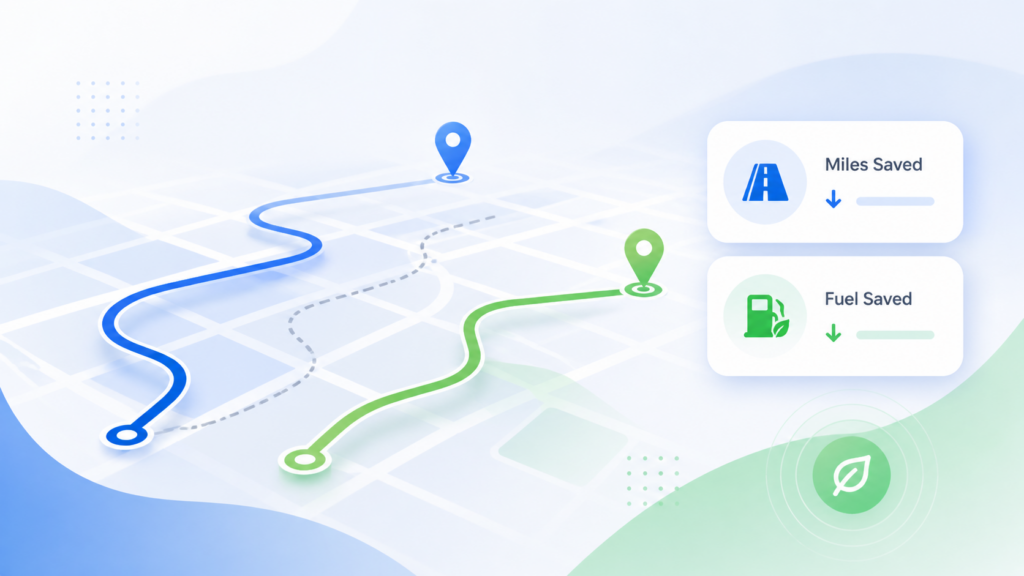
- A study of municipal waste collection in Austin, Texas found that GIS-based route optimization saved up to 18.2% in travel distance and 41.9% in travel time depending on truck configuration and waste density.
- A 2024 industry case study on Meridian Waste, a private hauler in Charlotte, NC, reported a 21% reduction in route miles, 26% route elimination, and 34% reduction in solid waste vehicles needed after deploying route optimization across one of their markets.
- An Environmental Studies Institute review of waste-collection optimization found typical results include 20% route length reduction, 30% fewer turns, and up to $200,000 in annual collection cost savings for mid-sized operations.
- Across-industry fleet data suggests 10-15% fuel savings in the first quarter post-implementation, with some operators reaching 20-25% as drivers adapt to optimized routes.
A reasonable expectation for a septic operator moving from manual routing to good routing software: 10-15% reduction in drive miles in the first 90 days, climbing toward 15-20% over the first year as the system learns your data and dispatchers adapt their workflow. That’s the conservative range. Operators starting from very inefficient baselines (paper maps, no clustering, no disposal-site logic) can see substantially more.
Why septic-specific software matters for routing
When you start evaluating routing tools, the most important distinction isn’t between vendors – it’s between generic field service software and software built for septic specifically.
Generic route planners are designed for delivery and field service in general. They handle the underlying routing math well, but they don’t know anything about the constraints that actually shape septic operations: gallon-level tank capacity tracking, approved disposal-site routing, waste manifest generation, or pump-volume billing. You’ll spend a lot of time forcing your business into a data model that wasn’t built for it – and the routing decisions the software makes will reflect that.
Tank Track was built specifically for septic, grease, and portable sanitation operators. That means the routing engine factors in the things that matter for this work: how full each truck is, which disposal sites are approved and reachable, when each tank needs to go to the dump, and how to keep manifests clean for state reporting. The optimization isn’t bolted onto a generic platform – it’s part of an integrated workflow where routing, billing, compliance, and mobile all share the same data.
For most operators running 1-15 trucks, this integration is the difference between software that saves you real money and software that creates new problems while solving old ones.
Calculating your own potential savings
Want to estimate what septic route optimization could be worth for your specific operation? Here’s the back-of-envelope math:
- Annual miles per truck. Pull this from your odometer logs or your existing software. Typical residential operators run 30,000-60,000 miles per truck per year.
- Truck MPG. Most vacuum trucks get 6-9 MPG depending on chassis and load. Heavy service vehicles like garbage trucks average around 2.5 MPG industry-wide, but lighter septic trucks typically do better. If you don’t know your real MPG, use 8 as a starting estimate.
- Current fuel cost. Use your actual rate, or the EIA national average. At $5.35/gallon as of late April 2026.
- Realistic mile reduction. Use 10% for a conservative estimate, 15% for a typical case, 20% for an aggressive case.
The formula: (Annual miles × reduction %) ÷ MPG × diesel price = annual fuel savings per truck.
For a typical operator with 3 trucks at 45,000 miles each, 8 MPG, $5.35/gallon, and a 15% reduction: about $13,500/year in fuel savings across the fleet. If routing software costs $200-400 per truck per month, the math works at the first truck and gets dramatically better with each additional truck.
And again, fuel is the easy savings to model. Labor productivity (more jobs per truck per day) and reduced overtime usually swamp the fuel number for operators who can fill the additional capacity with new work.
When to invest in septic route optimization software
If you’re a one-truck operation with a stable customer base of 100-200 accounts, you can probably manage routing with paper, a wall map, or even Google Maps. You’ll lose efficiency, but the labor of managing software might exceed what you’d save.
The threshold where the math definitively flips:
- Two or more trucks running concurrent routes. The moment you’re balancing workloads across drivers, manual routing leaves significant money on the table.
- More than 15-20 jobs per day across your fleet. Past that volume, the cognitive load on dispatchers becomes the bottleneck.
- Multiple disposal sites. Optimization software handles dump-site logic in seconds; humans approximate it badly.
- You’re growing. Software scales; spreadsheets and tribal knowledge don’t. Every operator we work with who waited until they “needed it” wishes they had implemented sooner.
How to actually adopt routing software without disrupting operations
The most common failure mode isn’t picking the wrong software – it’s adopting it badly. A few principles that consistently work:
- Pilot with one truck for 30 days. Don’t roll out to the whole fleet at once. Pick your most flexible driver and run optimized routes against the existing manual routes in parallel. Measure actual results before you scale.
- Clean your customer data first. Routing engines are only as good as the addresses you feed them. If 5% of your customers have bad addresses or pin drops in the wrong yard, your optimized routes will look wrong even when they’re mathematically correct.
- Train dispatchers on exception handling, not optimization. The software handles the optimization. What dispatchers need to learn is how to handle the 10% of cases the software can’t solve cleanly: emergencies, last-minute cancellations, customer special requests, equipment breakdowns.
- Get driver buy-in early. Drivers who don’t trust the routes will silently re-sequence them or skip stops, which destroys both your data quality and your routing engine’s ability to learn. Walk drivers through the first few optimized routes; let them flag anything that looks wrong; iterate.
- Measure before-and-after metrics. Miles per route. Jobs per day per truck. Fuel cost per job. On-time arrival rate. If you can’t show real numbers after 90 days, you can’t make the case to expand.
For operators looking at how this works in practice, our existing post on Tank Track’s Google Maps integration walks through how septic route optimization plays out inside the software – automated stop sequencing, drag-and-drop adjustments, and disposal-site routing on a live map.
What’s next
If you’re evaluating routing software as part of a broader software decision, our [septic business software buying guide] covers what to look for across routing, billing, compliance, and mobile. If you’re earlier in the process and trying to decide whether your routes are even the right problem to solve, our [pricing post] walks through how to identify the highest-leverage operational improvements in your specific business.
If you’re ready to see how septic route optimization works inside Tank Track specifically, [request a demo].
Frequently asked questions
How much can septic route optimization realistically save? For most operators moving from manual routing to good optimization software, expect 10-15% reduction in drive miles in the first 90 days, climbing toward 15-20% over the first year. Translated to dollars at current diesel prices ($5.35/gallon as of late April 2026), that’s roughly $4,500 per truck per year in fuel savings, plus typically larger savings from labor productivity (more jobs per truck per day).
Why does software built for septic matter for routing? Routing math is the easy part – any decent engine can sequence stops by drive time. What separates real septic route optimization from a generic delivery planner is whether the software understands tank capacity, approved disposal sites, waste manifests, and pump-volume billing. Tank Track was built around those constraints from day one, which is why our routing decisions reflect how septic operations actually work.
What’s the difference between route planning and route optimization? Route planning means sequencing stops in some order, often the order they came in. Route optimization means actively solving for the best sequence given constraints (truck capacity, time windows, disposal sites, traffic). Optimization is a math problem; planning is just a list.
How long does it take to roll out routing software? Plan for 30-60 days from contract signing to full fleet deployment. The first 2-4 weeks are typically data cleanup (addresses, customer records) and initial pilot with one truck. Full fleet rollout typically follows in weeks 4-8 once dispatchers and drivers have built confidence with the system.
Will routing software replace my dispatcher? No. It changes what your dispatcher does. Instead of building routes from scratch, dispatchers spend their time on exceptions, customer communication, and proactive scheduling. Most operators find their existing dispatcher gets more productive with routing software, not redundant.
Tank Track is field service software built specifically for septic, grease, and portable sanitation operators. If you want to see how septic route optimization works inside our platform, [request a demo].